When Do I Use That Model?
For the Statistically Confused
Once you've learned all the GLMs, it can feel a little overwhelming. You feel simultaneously empowered and confused. You know what the models are, and a little bit about how they work, but you have no idea when to use them. A useful (but not foolproof) way to tell is by first determining what kind of question you have. This guide is meant to do just that - relate models to questions, and to different types of dependent variables. Anything in blue text is a link to a journal article.
Binary Logit and Probit Models
How likely is a person to choose/do one thing over exactly one other thing?
You use binary logit and probit models when you want to talk about the probability that someone will do something. If you think about it, this is a significant portion of what sociologists want to do - we want to understand how different factors relate to the likelihood that a person will or wont do something.
A standard logit/probit question in stats books is voting: e.g., How likely is a person to vote for Barack Obama in the 2008 elections? But, there are almost an infinite number of possibilities. You could estimate the probability that someone will donate blood. You could estimate the probability that someone will intend to migrate or not. You could estimate the probability that someone will sign a petition or not. What's important to realize is that binary doesn't just mean yes/no. For example, you could estimate the probability that someone will attribute povery to structural or individual causes. Anything that's two distinct (and exhaustive) categories will work.
So, in a nutshell, ask yourself these two questions to determine if you need to use binary logit/probit. First, is my dependent variable two choices (and only two choices?). Second, do I want to know the probability that someone will choose one group or the other? If so, use binary logit/probit.
Poisson & Negative Binomial
How many _ does a person have?
Poisson models are a little less intuitive. They are usually used in social science to measure counts (integers) of things. In particular, it involves counts of things when people usually only have a few of that thing. This type of data applies to more questions than you might initially think.
For example, credit cards, children, traffic tickets, or number of friends are all measured in whole numbers. Furthermore, people don't often have many more than one or two of them. So, as the number of cards, children, etc. goes up, the probability that a case will exist with those counts goes down. We end up with a distribution that looks like this:
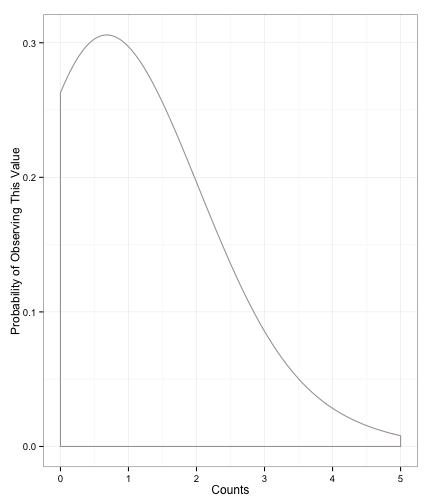
Fig1: Poisson Distribution
You can see how this distribution fits the cases we mentioned above: we expect most people to have one or two, and people with many, many more are less likely. You can even use these models to estimate the numbers of certain kinds of words in a press release.
More recently, people have realized that income (in actual dollars, not broken into groups) looks a lot like the Poisson distribution. So, even though the numbers are huge, and not always integer counts, we use Poisson to model income since it matches income's distribution well.
Negative Binomial. A quick note about negative binomial regression. In Poisson regression, we make an assumption about the mean and variance after taking the independent variables into account. The assumption that we make is that the mean and the variance are the same. Because the mean and the variance are the same, we can specify them with one number, which is often called lambda (λ). Negative binomial regression is similar to the Poisson regression, but we add an error term to the model to account for the fact that the conditional mean ≠ the conditional variance. In practice, you'll use this most of the time, rather than Poisson. The good news is that it's interpreted the same as Poisson (coefficients are logged counts), and you just have to type negbin rather than poisson.
Ordered/Ordinal Logit/Probit
How much does a person want to do _? How often does a person _?
Ordered logit and probit are, quite possibly, the most confusing type of model we apply. We apply these models when our dependent variable is ordinal. That is, when it is broken up into groups whose order matters.
What might be confusing is that we sometimes estimate these variables using OLS regression. Here's a general rule:
When your dependent variable has five or more categories that are relatively evenly spaced, use OLS. If it has less than five, or the categories aren't evenly spaced, use ologit/oprobit.
To what types of variables does this apply? Any Likert Scale (Disagree/Agree) with more than two, but less than five options; a scale of church attendance (Never, Once a Year, Once a Month, One a Week); a measure of how likely a respondent is to promote an individual; a white person's reported likelihood of moving into a white neighborhood. You can see how, for these variables, order matters. At the same time, the categories aren't evenly spaced. So, we use ordered logit or probit.
Multinomial Logit/Probit
Which _ did a person choose?
Multinomial logit is actually pretty simple: use this this method when your dependent variable is nominal. It could be the type of college an individual attends, which newspaper they read, or which country they emigrated to. In other words, if your dependent variable has several categories, isn't ordered, and the variable labels are names, rather than levels or numbers, you want mlogit.
Another time that you use multinomial logit is if your model doesn't fit the assumptions of ordered logit. So, if you run an ordered logit, but it fails the proportional odds test (brant in Stata), then you use multinomial logit instead.
If you want to see a (rough) search of all multinomial logit and probit regressions in ASR and AJS, click here.