College sports represent an ideal, and under-appreciated, opportunity for organizational study. We have founding dates for all universities and each of their athletics programs. Status systems (both academic and athletic) are standardly-defined and relatively comparable across decades. Institutional variation (private, public, liberal arts) creates clear delineations in athletic expectations. We also increasingly have access to fine-grained data about the constituents of college teams: coach lineages and salaries, and tons of data on players.1 Perhaps most importantly, there is significant variation in success. Sure, a few teams (the "blue bloods") are perennial favorites to win each championship. But sometimes Auburn beats Alabama on a last-second field goal return, and sometimes Duke loses in the first round of the tournament.
What accounts for variance (or lack thereof) in athletic success? Another way to put it is: why is the SEC consistently so damn good at football? One thing is for certain: you can't have a consistently great college football team without consistently great players. Sure, many coaches can develop less-talented players into Heisman winners and NFL draft picks, but many of the top players in the NFL were at the top of their class in high school and college as well. There's an entire cottage industry based around ranking recruits each year; Rivals.com (now owned by Yahoo!) was the first to do it, and now ESPN maintains similar rankings. It seems probable that some of the variation in team success comes from that school's ability to consistently recruit good players.
Data
All data comes from Rivals 100 rankings. The data include the last seven years of the Rivals.com 100 (2009-2016). This includes almost six years of complete data, in which each of the 100 have picked their respective programs (2009-2014), and seven years of player data (2009-2016).2 Many of the 2015 Rivals 100, and some of the 2016 Rivals 100 have already committed to schools. So, if Rivals.com lists a school next to an individual, they are included. The final sample size of complete data is 596 players.
Where Do The Best Players Come From?
First, let's look at where the best players come from.

The South, and particularly the Gulf South, dominates the map. There are expected clusters of top recruits around larger cities, but even these clusters are disproportionate to population. For example, Chicago and NYC have fewer recruits than, say, Atlanta, Charlotte, and Tampa. This isn't surprising, for anyone who has seen Friday Night Lights, but it is striking. Let's look at the map by position:
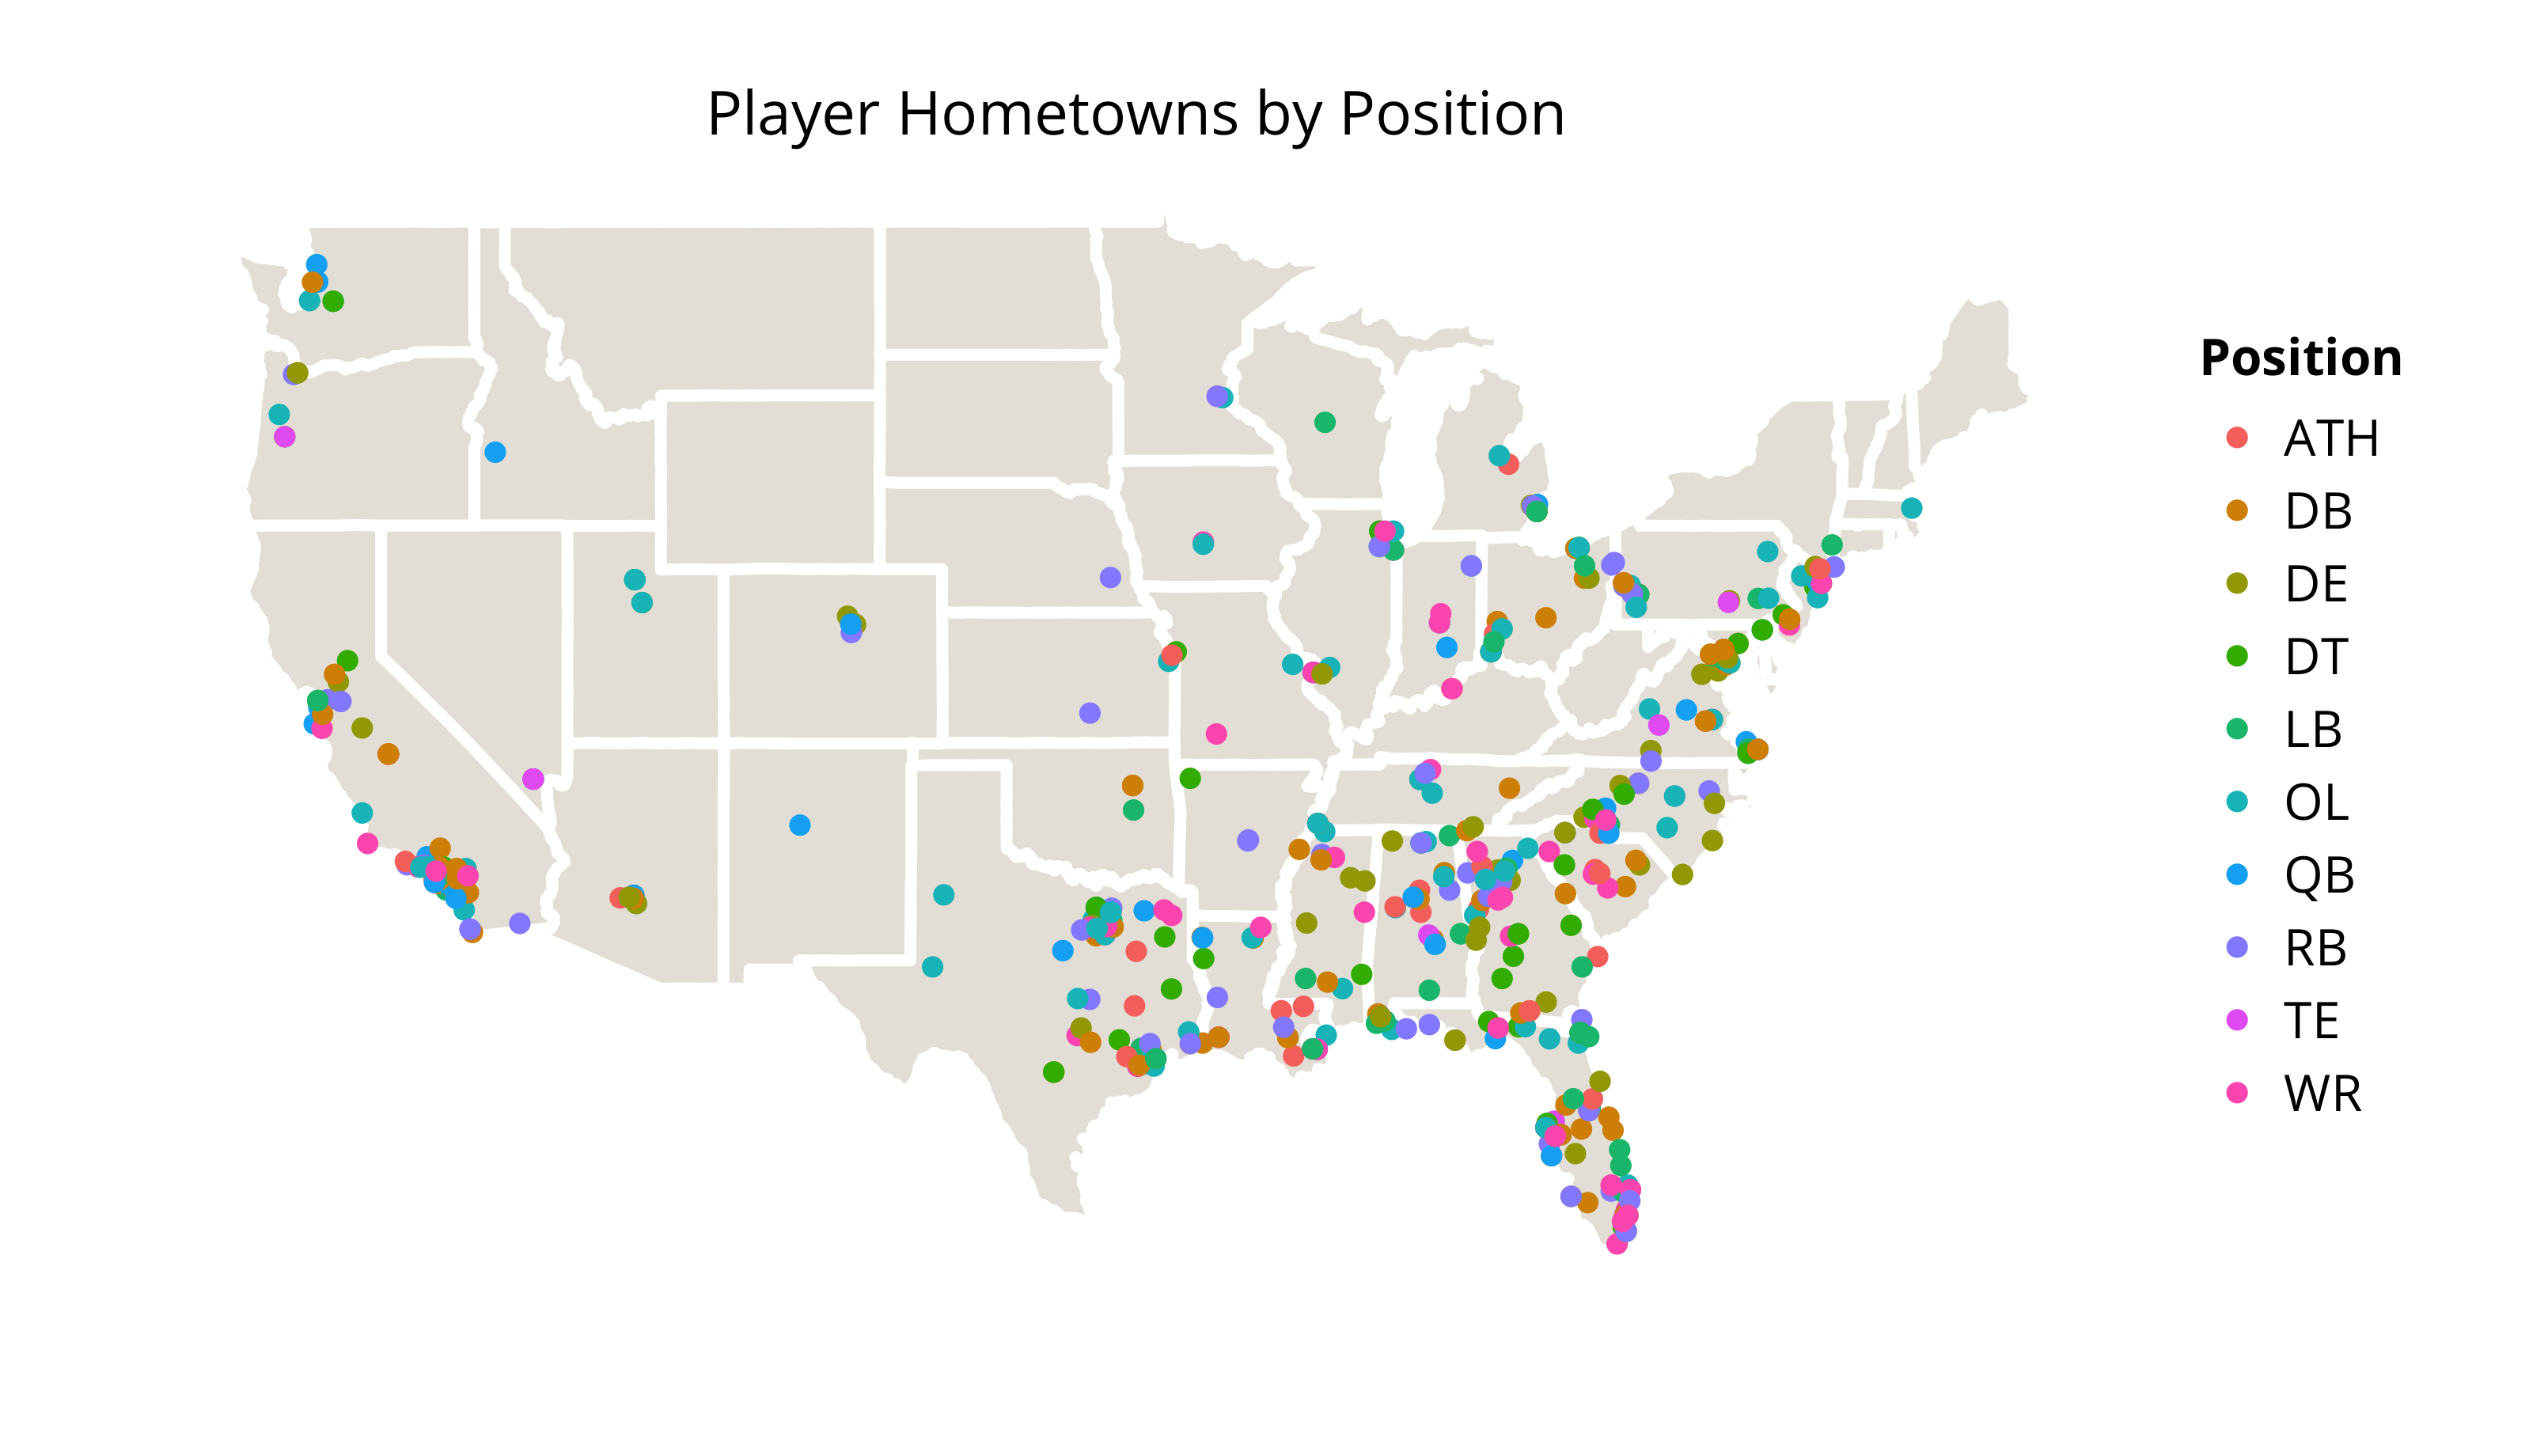
Again, The Gulf South more or less dominates across the board. Southern California's QB Factory shows up, with a clump of Blue (QB) and Pink (WR) dots. Massachusetts' lone Rivals 100 player is an Offensive Lineman (John Montelus, Notre Dame's 2013 Class), and Wisconsin's lone player is a linebacker (Vince Biegel Wisconsin's 2012 Class).3
Who Gets the Most Top-100 Recruits?
So, where do these recruits go for college?

Again, no real surprises here. Alabama dominates the Rivals 100, boasting 54 of the 596 players with school commitments in the data (9.06%). A surprise in the second-place position is USC, with 42 top recruits. This is particularly surprising given the recent sanctions against the school. Many of them appear to be Lane Kiffin recruits (2011-2013), for whatever that's worth to him. Notre Dame is 10th, which is a bit sad, but impressive given that Stanford is 19th. Out of the top 10 teams, 5 are from the SEC. Tennessee is a surprise, but, again, many of these are Kiffin recruits (2009-2010). Say what you will about the man, but he can sure recruit.5 The graph shakes up a bit when we limit recruits to those from out-of-state:

Again, Alabama dominates, followed by Ohio State, Tennessee, and then Notre Dame. ND's position here isn't surprising; most of their recruiting has to be from out-of-state, given the paltry offerings within the state. Since 2010, ND has scooped up three of the four top recruits from the state, including both 5-star recruits (Gunner Keil, QB 2012, who is now at Cincinnati; and Jaylon Smith, LB 2013). The lone defector is Austin Roberts (WR, UCLA 2014).
Of the top-10 out-of-state recruiting classes, 6 are from the SEC. Auburn and Clemson both make jumps (#8 and #9, respectively), and Georgia falls just outside the top 10 at #11. It's likely than many of these players come from nearby states, since so many good players come from there. This bears out; Auburns out-of-state players are from SC, GA, AR, FL, MS, TX, LA, and (oddly) one from KS. Clemson recruits from FL, GA, NC, and VA, with one lone recruit from MN. There are outliers, but the bulk of players come from GA and FL. Something in the water or something.
In-State Stars
The last map is the percentage of players in each state who stay in-state for college:
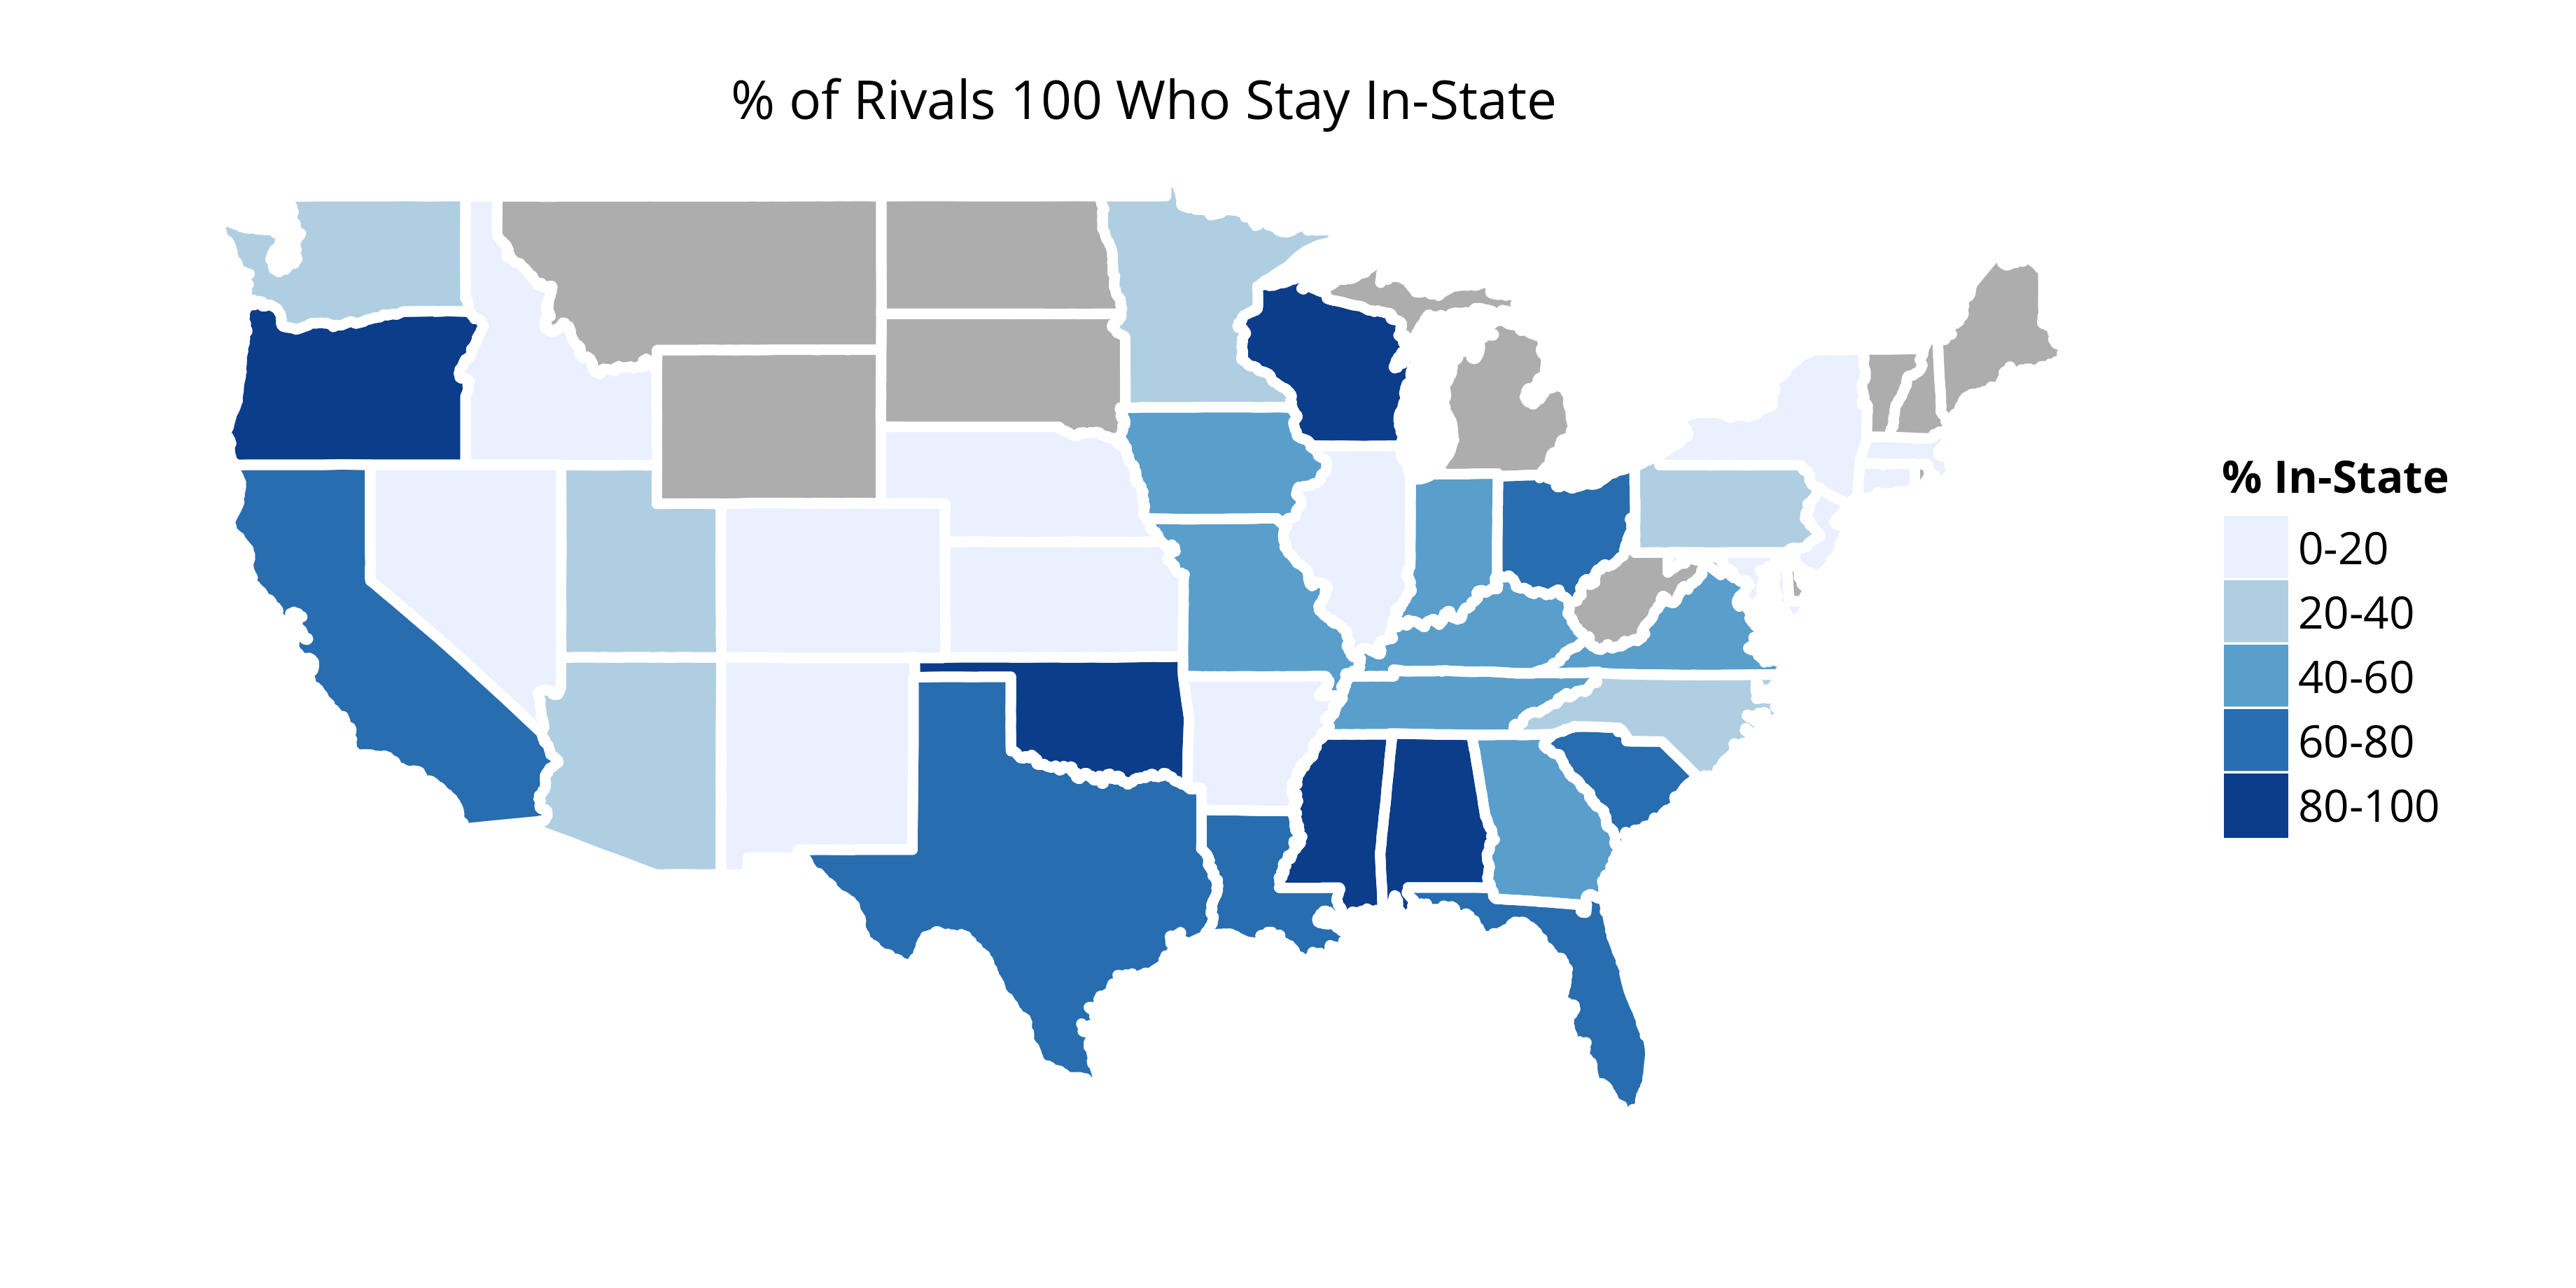
Here again, the south dominates, although Georgia sends lots of people (comparatively) out of state. California, Texas, and Florida all benefit, because they have high numbers of recruits, and many of their recruits stay in state.
But here's the most telling of all. The average distance a player travels to go to college: 20 miles of latitude, and about 75 miles of longitude.4 That's not very far at all, meaning we have a lot of local legends who stay local legends. And that's a very good thing for the SEC.
Thanks to Flickr user philipsphotos for this image of the Southlake Carroll Dragons.
-
FORESHADOWING! ↩
-
Manti Te'o, the lone non-continental recruit, is omitted. ↩
-
Neither the position nor the school is a surprise. ↩
-
These aren't exact, because of how longitude and latitude work, but they're close ↩
-
Thanks to Reddit user RobertNeyland for pointing out that many of Tennessee's recruits are by Kiffin, but most of them (10, in fact) are by current head coach Butch Jones. ↩